
Zignals
Zignals launched in July 2008 as a stock alert and charting tool built in Microsoft Silverlight. Over subsequent years, new features were added, including a trading strategy builder, portfolio manager, watchlists, quote board, trade timer and pattern DNA that made Zignals a one-stop shop for investors. In 2014, Zignals 2.0 relaunched as an HTML5 alert and charting platform, and set the basis for its acquisition in 2015 by KX Systems | First Derivatives.
Task
This was a comparative study of users familiar with the Microsoft Silverlight iteration of Zignals v1.0 and had moved to Zignals 2.0 in HTML5. Ten users were selected for the study. Their selection was based on past history in providing useful and critical feedback to the team; experience with the platform did vary within the group.
Collaboration
Aside from feedback from the team on the survey and the selection of candidates, this was an individual effort.
The Questionnaire
A questionnaire was emailed out to participants that included a brief introduction as to past, present and future of Zignals, along with instructions on how to complete the form.
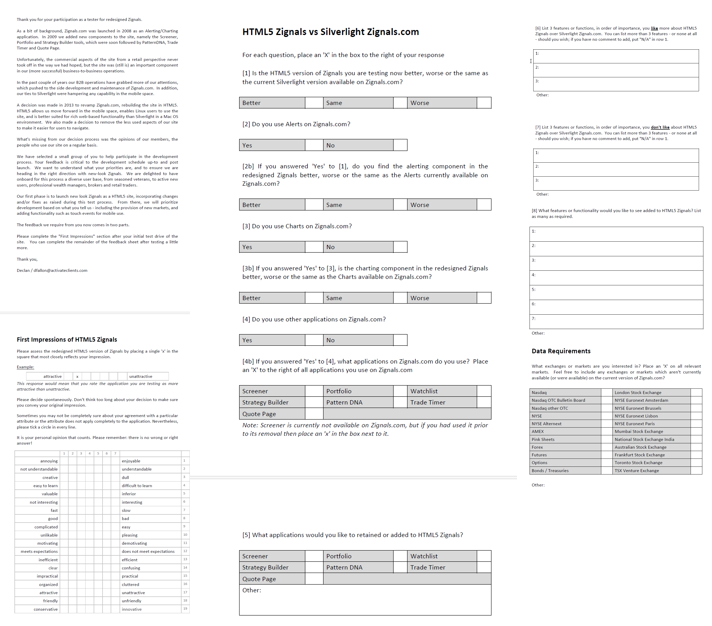
The first section was to garner a first impression of the new HTML5 version of Zignals relative to the old Silverlight one. Users responded on a semantic differential scale.
The second section asked about specific features customers used, followed by a simple better/worse assessment between the HTML5 and Silverlight versions. And, what Silverlight features they would to see upgraded to HTML5.
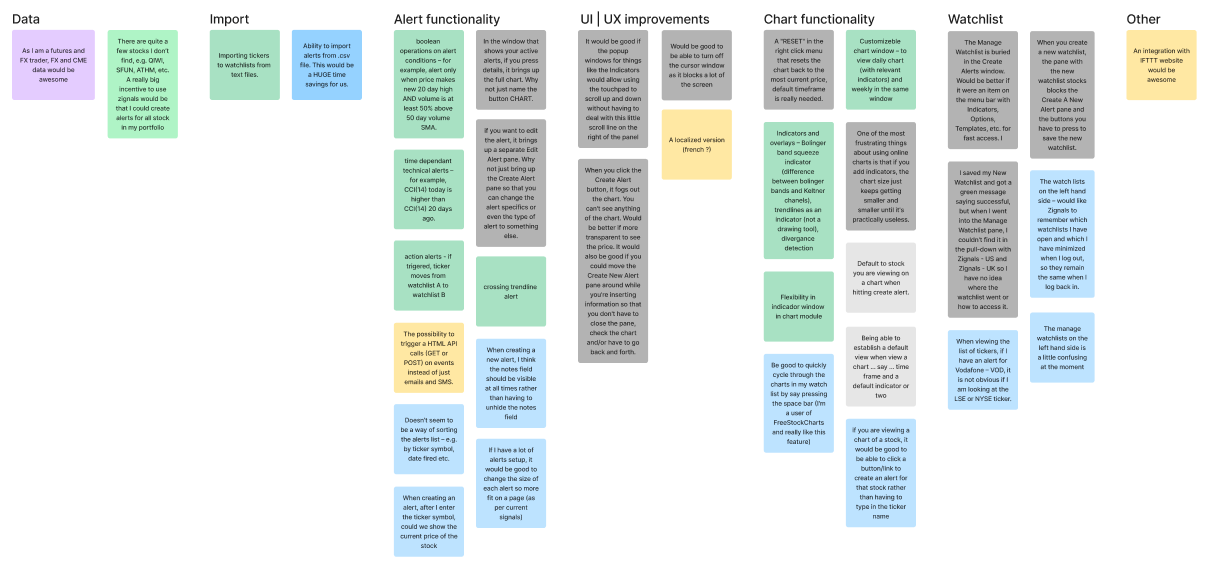
The last section asked for feedback; likes, dislikes and feature requests. This was open ended feedback and responses were organised into an affinity map.
Semantic Analysis
The goal was to get an overall opinion of the new look and HTML5 functionality. There were pros and cons to our findings, which I will outline, but the semantic analysis did help identify UX priorities. As a quantitative measure, it provides a definitive score along the scale, but that doesn’t tell the whole story.
Starting from top-to-bottom in the survey, our users found the new Zignals HTML5 platform as enjoyable and creative to use, which was a positive start. However, when we factored if it was easy to learn or understandable, there were two distinct camps; half of users found it understandable, the other half did not. This concern was alleviated by the majority finding the platform easy to learn, but the split raised a red flag as to first impressions for the platform.
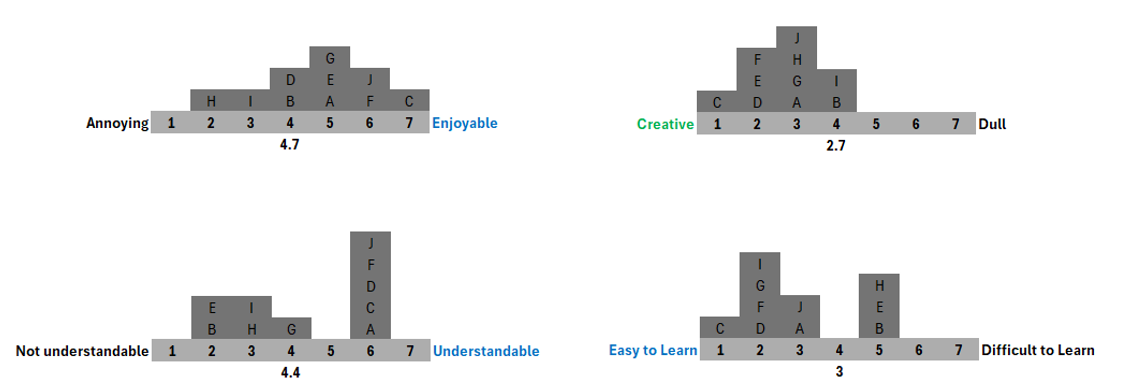
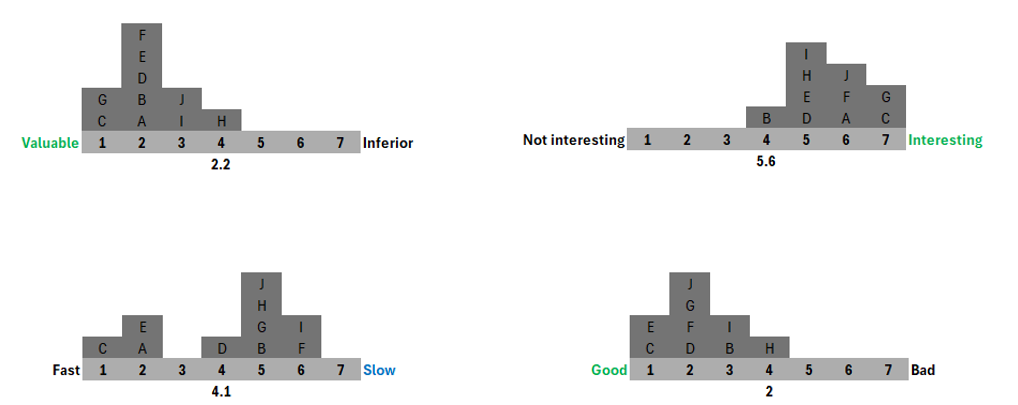
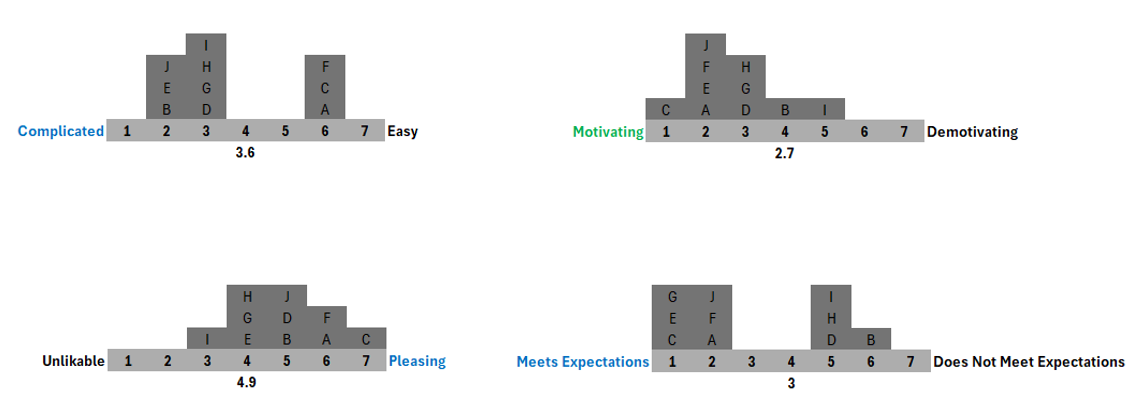
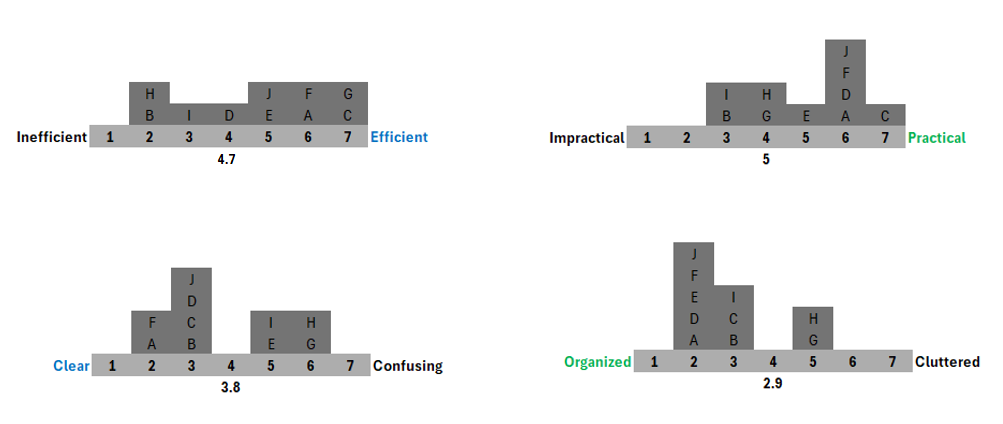
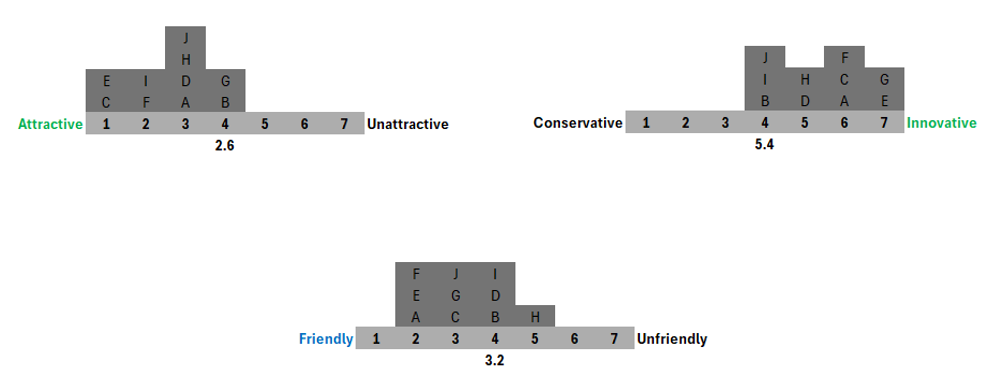
Collectively, there were some contradictions in the respondents answers. The average score for each metric favoured the positives, but masked the negatives; there is a 40% cohort of respondents who found Zignals HTML5 to be slow, difficult to understand, confusing and complicated. Performance issues aside, there is still a sizable group of users looking for a better user experience.
Feature Usage
The migration of the Zignals Platform from Microsoft Silverlight to HTML5 was a phased process, starting with the mostly commonly used features: Alerts and Charts. We asked respondents what features used, and whether the HTML5 version was better or worse than the Silverlight version.
Of the flagship Strategy Builder (the original premise for Zignals), we only had one respondent look for it in HTML5, but had also responded to not using it in Silverlight.
Was the HTML5 version of Zignals better or worse than the Silverlight version?
Not everyone answered this, but of those that did, 62% said it was worse. This definitive result forces the hand of respondents more than semantic analysis.
Do you use Alerts on Zignals.com?
All respondents had answered ‘yes’ to this question. Our early SEO success had positioned Zignals as the global number 1 search result for “Free Stock Alerts” and “Stock Alerts”, making us the primary provider of investor alerts in the world.
Do you find the HTML5 alerting component better or worse than the Silverlight version?
Only 29% said it was better, 14% said it was the same, and the rest said it was worse. From a UX perspective, the Silverlight version had five years of development invested in it whereas the HTML5 version was brand new. The HTML5 version was not as feature rich as the Silverlight version, but it was disappointing not to have the version built for the universally preferred web format perform better.
Do you use Charts on Zignals.com?
Charts was our next most commonly used web application, but only 38% of respondents actually used it.
Do you find the HTML5 charting component better or worse than the Silverlight version?
Charts fared better than alerts, with 66% saying the HTML5 version was better than the Silverlight version.
Do you use other applications on Zignals.com?
Only 16% of respondents (one person!) used another application (out of seven) available on Zignals.com. Whether victims of our own success with stock alerts, it was disappointing not to see users try some of other application given the time invested in developing them.
What other applications did you use on Zignals.com?
The one respondent who had replied ‘yes’ to the previous question used the portfolio and watchlist tool.
What other applications would you like to see converted to Zignals HTML5?
It was interesting to see that more respondents replied to this (50%), than actually used the existing Silverlight applications! There was a preference to see Portfolio, Stock Watchlists and Quote pages converted over to HTML5.
Of the flagship Strategy Builder (the original premise for Zignals), we only had one respondent look for it in HTML5, but had also responded to not using it in Silverlight.
Affinity Maps
The last section took an open-ended approach where we asked respondents to list what they liked, disliked and wanted to see next for Zignals HTML5.
What features users liked with Zignals HTML5 over the Silverlight version
The affinity map pooled over five key areas:
- Alert functionality
- Chart functionality
- Performance – somewhat ironic given the results of the semantic analysis
- UI design
- Plug-in free
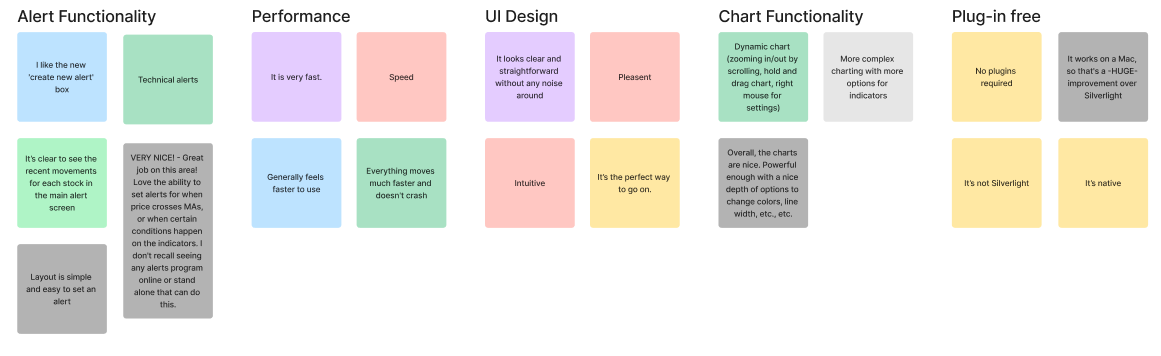
Users loosened up on this and didn’t hold back. The updated UI design came up for particular criticism.
- Missing Alert functionality
- Missing Chart functionality
- UI design
- Missing (general) features
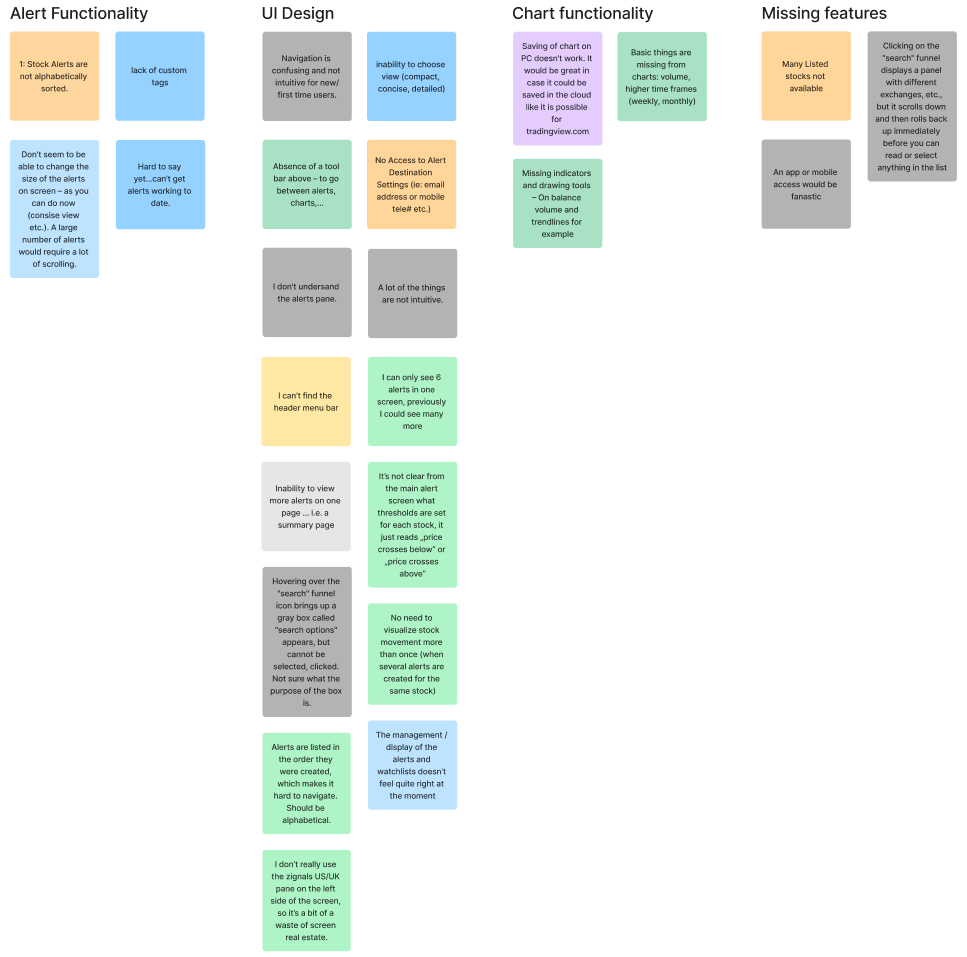
There was a good deal of feedback in this regard. There was one item I couldn’t really categorize, but other items fell into distinct silos.
- Data Options
- Import
- Alert functionality
- UI | UX improvements
- Chart functionality
- Watchlists
Conclusion
With acquisition of Zignals | ActivateClients in 2015 there was no release of Zignals HTML5 v2.1. However, many of the lessons learned from this were applied to the development of KX Dashboards in use today.
See the Research
I had the pleasure of collaborating with Declan on the UX team at KX. We primarily worked together on usability testing projects, where his meticulous approach consistently impressed me.
Declan's background in analysis and data visualisation is a true asset. He demonstrated these strengths regularly when delving deep into user data, uncovering hidden trends and patterns, and communicating his findings with exceptional clarity and impact. This analytical mindset proved invaluable during user interviews, allowing him to effectively probe and understand user needs.
Beyond his exceptional skills, Declan is a fantastic colleague. He's a true team player, always willing to lend a hand and contribute positively to the team's success. I thoroughly enjoyed working with him and highly recommend him for any role that values meticulous attention to detail and a passion for user-centered design.
— Siobhan Stevenson, UX Designer